Cognitive Creations Strategy · Governance · PMO · Agentic AI

Observability, KPIs, Governance, and Kill Switch Integration for AI Agents

Hero — What this banner represents

Download as PDF

1 — 1. Purpose

1. Purpose

1. Purpose

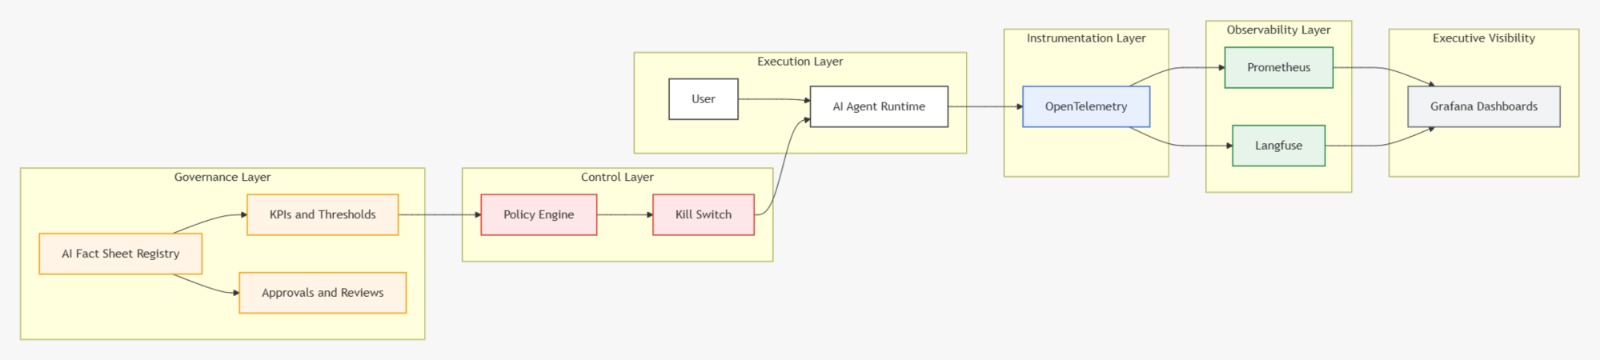
This document defines the architecture, tools, flows, and responsibilities required to implement a mature observability + governance stage for an AI Agent, connecting:

  • Technical telemetry (health, latency, error rate)
  • LLM/agent quality signals (traces, prompts, token/cost)
  • Governance artifacts (AI Fact Sheets)
  • Risk controls (Policy Engine)
  • Rapid containment (Kill Switch)

Goal: transform an experimental agent into an enterprise asset that is auditable, controllable, secure, and operationally reliable.

3. Problem Statement

Without an integrated stack, AI agents typically:

  • Fail silently (no early detection)
  • Hallucinate without accountability
  • Create unpredictable token/cost burn
  • Lack auditability and change history
  • Cannot be safely contained during incidents

Typical outcome: reputational, financial, compliance, and security risk.

2 — 2. Enterprise Principles

2. Enterprise Principles

2. Enterprise Principles

  • Nothing runs without observability (you can't govern what you can't see)
  • Every relevant metric becomes a governed KPI
  • Every KPI has thresholds and explicit consequences
  • Every decision is documented and versioned (Fact Sheet)
  • Every agent can be degraded or stopped within seconds
3 — 4. Reference Architecture (Value Layers)

4. Reference Architecture (Value Layers)

4. Reference Architecture (Value Layers)

LayerPrimary FunctionBusiness ValueTypical Tools
InstrumentationStandard telemetry emissionAvoid vendor lock-inOpenTelemetry
Core MonitoringTechnical metrics + alertingReliability, stabilityPrometheus + Alertmanager
LLM ObservabilityTraces, prompts, token/cost, evalsExplainability & debuggingLangfuse
GovernanceRegistration, versioning, approvalsAudit & complianceAI Fact Sheets (Custom / MLflow)
Active SafetyValidate input/output/actionPrevent incidentsGuardrails / OPA
Critical ControlInstant containmentDamage mitigationFeature Flags / Kill Switch
Executive VisibilityUnified dashboardsDecision-makingGrafana
4 — 5. High-Level System View (Horizontal)

5. High-Level System View (Horizontal)

5. High-Level System View (Horizontal)

Execution → Instrumentation → Observability → Governance → Control → Executive Visibility.

Enterprise Governed AI Agent — Observability + Governance horizontal flow

Figure 5 — High-Level System View (Horizontal)

Execution Layer (User → Agent) → Instrumentation (OpenTelemetry) → Observability (Prometheus, Langfuse) → Governance (Fact Sheet, KPIs, Approvals) → Control (Policy Engine, Kill Switch) → Grafana.

5 — 6. Instrumentation (OpenTelemetry)

6. Instrumentation (OpenTelemetry)

6. Instrumentation (OpenTelemetry)

Role

OpenTelemetry is the standard telemetry language used by the agent. It enables: consistent instrumentation, vendor independence, multi-agent comparability, multi-environment scalability.

OpenTelemetry answers: How can the agent emit signals once, without caring who consumes them?

What the agent emits via OpenTelemetry

  • Metrics: counts, rates, histograms
  • Traces: end-to-end execution paths
  • Logs: structured events and errors

The agent does not know whether Prometheus, Langfuse, or another system receives them.

Why OpenTelemetry matters

Without itWith it
Duplicated instrumentationConfiguration changes, not code changes
Hard vendor lock-inScalable governance
Fragile migrationsFuture-proof observability

A mature agent platform must support: multi-agent architectures, multiple environments (dev/pilot/prod), and changing observability vendors without rewriting the agent.

6 — 7. Core Technical Metrics (Prometheus)

7. Core Technical Metrics (Prometheus)

7. Core Technical Metrics (Prometheus)

Role

Prometheus acts as the early detection system for AI agents. It monitors technical health signals and provides the raw data from which reliability and performance KPIs are derived.

Prometheus answers: Is the system healthy and stable at runtime?

Primary metric types

Counters

Counters represent monotonically increasing values used to count events over time.

  • Total LLM calls
  • Total tool invocations
  • Total execution failures
  • Total policy rejections
llm_calls_total = 12,450 · agent_failures_total = 720

Counters do not indicate severity by themselves; they provide raw volume data.

Gauges

Gauges represent current system state and can increase or decrease.

  • Active sessions
  • Request queue depth
  • Memory consumption
  • Concurrent agent executions
active_sessions = 120 (potential saturation) · queue_depth = 30 (backlog forming)

Gauges provide real-time stress indicators.

Histograms

Histograms measure distribution of values, most commonly latency.

  • P50: median experience
  • P95: experience of most users (UX critical)
  • P99: worst-case behavior
Latency P50 = 900 ms · P95 = 8,200 ms · P99 = 14,500 ms

Averages are misleading; P95 is the enterprise standard.

KPIs derived from Prometheus

KPIDescriptionWhy it matters
Error Rate% failed executionsReliability
Latency P95User-perceived response timeAdoption & trust
ThroughputRequests per time unitCapacity planning
AvailabilityUptime + health checksOperational stability
Governance boundary
Prometheus does not define KPIs. It provides signals that governance interprets.

Alerting (Alertmanager): Alerts should be mapped to actionable governance states, not just notifications.

7 — 8. LLM / Agent Observability (Langfuse)

8. LLM / Agent Observability (Langfuse)

8. LLM / Agent Observability (Langfuse)

Role

Langfuse explains what the agent did and why, capturing the agent's internal execution narrative.

Langfuse answers: How did the agent reason, and was the outcome trustworthy?

What Langfuse observes per execution

  • Final composed prompt (system + user + context)
  • Retrieval results and similarity scores
  • Tool calls (sequence, parameters, failures)
  • LLM outputs
  • Token usage and cost
  • Human and automated evaluations

This creates a complete traceable execution story.

Key capabilities

  • Step-by-step tracing (multi-step agent flows)
  • Prompt/version management
  • Token/cost analytics per user / workflow / environment
  • Human + automated evaluations (quality, safety, relevance)

Typical agent quality KPIs

KPIPurposeExample
Cost per successful outcomeFinancial control$0.18 per resolved case
Response quality scoreTrustHuman rating 4.5 / 5
Hallucination / ungrounded rateRisk2.4% flagged outputs
Tool failure rateReliability1.2% tool errors

How hallucinations are detected (operationally)

Langfuse does not guess hallucinations. It identifies risk signals, including:

  • Grounding mismatch (RAG): Low retrieval similarity + confident answer
  • Tool avoidance: Expected tool not used
  • Inconsistency: Same input produces conflicting answers
  • LLM-as-judge evaluation: Secondary model scores grounding
  • Human feedback: Explicit negative ratings
Hallucination Rate = Flagged Ungrounded Outputs / Total Outputs

This KPI typically triggers degradation, not immediate shutdown.

8a. Data and context drift detection

Input (user intent) drift

Detected by: embedding distance changes, new intent clusters, vocabulary shifts.

Meaning: The agent is being used outside its intended scope.

Context / knowledge drift (RAG)

Detected by: drop in average retrieval scores, decreasing document hit frequency, increased ungrounded responses.

Example: Average retrieval score — Last month = 0.62, Current = 0.31

This indicates outdated data, broken indexing, or misaligned embeddings.

8 — 9. AI Fact Sheets (Governance)

9. AI Fact Sheets (Governance)

9. AI Fact Sheets (Governance)

Role

An AI Fact Sheet is the official passport of an AI agent (or model/prompt bundle).

It answers: Is this agent allowed to exist, operate, and act — and under what conditions?

Minimum content standard

  • Purpose and intended users
  • Data sources and sensitivity classification
  • Allowed and restricted actions
  • Risk assessment (privacy, legal, safety)
  • Required KPIs and thresholds
  • Approval history (roles + timestamps)
  • Runtime governance state
  • Change and incident log

The Fact Sheet is the source of truth for governance.

Governance states and operational meaning

StateOperational meaning
DraftNot eligible for controlled execution
PilotLimited audience, limited actions, high logging
ApprovedProduction-ready, continuously monitored
RestrictedAction-limited due to policy or KPI breach
BlockedKill switch engaged, execution halted or safe-only
DeprecatedRetired, replaced, or sunset
State changes are not symbolic
They directly control runtime behavior.
9 — 10. Policy Engine (Active Safety)

10. Policy Engine (Active Safety)

10. Policy Engine (Active Safety)

Role

The Policy Engine enforces explicit authority boundaries before and after agent execution.

It answers: Is this input, output, or action allowed right now?

What the Policy Engine validates

Input validation: PII detection, prompt injection attempts, out-of-scope requests.

Output validation: Unsafe content, sensitive data leakage, ungrounded claims.

Action authorization: RBAC/ABAC permissions, tool scope enforcement, environment and state rules (Pilot vs Approved).

Policy Engine as concept vs software

Policy Engine is a capability, commonly implemented via:

  • Open Policy Agent (OPA) — Action authorization and state-based rules
  • Guardrails AI — Input/output semantic safety
  • Custom governance logic — KPI-driven decisions and kill switch integration

Most enterprise systems combine all three.

Example policy rules (real-world patterns)

  • Block PII exfiltration
  • Require human approval for external emails
  • Disable write actions in Pilot mode
  • Prevent tool calls outside approved tool list
  • Enforce data residency constraints (if applicable)

Policy KPIs

KPIWhat it indicates
Policy rejection rateAgent or user behavior misalignment
Repeated violationsTraining or prompt issues
Unsafe-output ratePrompt/RAG weakness
Human-in-the-loop rateReal trust level
Healthy signals
High rejection rates early are healthy signals, not failures.
10 — 11. Governed KPIs (Policy-Driven KPIs)

11. Governed KPIs (Policy-Driven KPIs)

11. Governed KPIs (Policy-Driven KPIs)

A KPI is not "informational"—it is decision-grade.

KPIThresholdGovernance Action
Error Rate> 5%engage kill switch for write actions
Hallucination Rate> 3%downgrade to Pilot + require HITL
Cost Overrun> +20%freeze deployments + governance review
Policy Rejection Rate> 2%restrict tools + security review
Latency P95> targetdegrade features or scale infra
11 — 12. Kill Switch (Critical Control)

12. Kill Switch (Critical Control)

12. Kill Switch (Critical Control)

Role

The Kill Switch is the final containment mechanism that can:

  • Disable specific actions
  • Force human approval
  • Enter safe-response mode
  • Halt execution entirely

Trigger logic (typical)

KPI threshold crossed → Prometheus alert fired → Governance rule evaluated → Fact Sheet state updated → Kill Switch activated → Agent behavior constrained.

Containment properties
Kill switches are fast, reversible, and auditable.

Implementation options (layered)

  • Feature flags (preferred)
  • Policy gate in runtime (mandatory)
  • Infrastructure stop (last resort)

13. Kill Switch Logic (Horizontal Decision Flow)

Signal Sources (Prometheus, Langfuse, Policy Engine) → KPI & Threshold Evaluation → Governance Update → Containment Controls (Feature Flag, Policy Gate, Safe Mode).

Kill Switch Logic — Signal sources to containment controls

Figure 13 — Kill Switch Logic (Horizontal Decision Flow)

Prometheus, Langfuse, Policy Engine → KPI Calculator → Threshold Rules → (breach) → Update Fact Sheet → State Transition → Feature Flag Flip → Runtime Policy Gate → Safe Mode Response.

14. Kill Switch Containment Modes (State Model)

"Kill switch" is not only "off"—it is progressive containment. Downgrades can be automated; upgrades require validation and approvals.

Kill Switch Containment Modes — Approved, Pilot, Restricted, Blocked state transitions

Figure 14 — Kill Switch Containment Modes (State Model)

Approved ↔ Pilot (KPI Warning) ↔ Restricted (Policy Violation) ↔ Blocked (Critical Incident). Upgrades require formal re-approval (audit logged).

12 — 15. Executive Visibility (Grafana)

15. Executive Visibility (Grafana)

15. Executive Visibility (Grafana)

Grafana consolidates: Technical reliability KPIs (Prometheus), Agent quality and cost KPIs (Langfuse), Governance state KPIs (Fact Sheet / Registry), Safety KPIs (Policy engine).

Executive-ready KPIs

  • Cost per successful outcome
  • % agents Approved vs Pilot vs Blocked
  • Policy rejection rate trend
  • Latency P95 vs SLO
  • Error budget burn-down (optional maturity)
13 — 16. End-to-End Golden Path (Operational Flow)

16. End-to-End Golden Path (Operational Flow)

16. End-to-End Golden Path (Operational Flow)

User → Request → AI Agent → Policy Check → (Allowed) Execute Tools / Retrieval / LLM | (Blocked) Safe Response + Log → Emit Telemetry (OTel) → Prometheus + Langfuse → KPI Evaluation → Update Fact Sheet / Kill Switch Action → Grafana Dashboards.

End-to-End Golden Path — User to Grafana operational flow

Figure 16 — End-to-End Golden Path (Operational Flow)

User → Request → Agent → Policy Check → Execute or Safe Response → OTel → Prometheus/Langfuse → KPI → Fact Sheet / Kill Switch → Grafana.

14 — 16. End-to-End Golden Path (Operational Flow)

16. End-to-End Golden Path (Operational Flow)

16. End-to-End Golden Path (Operational Flow)

User → Request → AI Agent → Policy Check → (Allowed) Execute Tools / Retrieval / LLM | (Blocked) Safe Response + Log → Emit Telemetry (OTel) → Prometheus + Langfuse → KPI Evaluation → Update Fact Sheet / Kill Switch Action → Grafana Dashboards.

End-to-End Golden Path — User to Grafana operational flow

Figure 16 — End-to-End Golden Path (Operational Flow)

User → Request → Agent → Policy Check → Execute or Safe Response → OTel → Prometheus/Langfuse → KPI → Fact Sheet / Kill Switch → Grafana.

Rate this article

Share your feedback

Optional: send a comment about this article.